Statistics describes and makes inferences about ‘populations’. A population is the entire group of individuals whose characteristics we are interested in.
This is achieved by using a ‘sample’ of individuals from the entire population.
Using the sample, we measure a characteristic whose value can vary from individual to individual (a ‘variable’) – age, tumour stage, blood pressure, performance status, weight, sex, occupation, and length of survival following radiotherapy are all examples of variables.
The values observed among individuals within the sample are called observations or data.
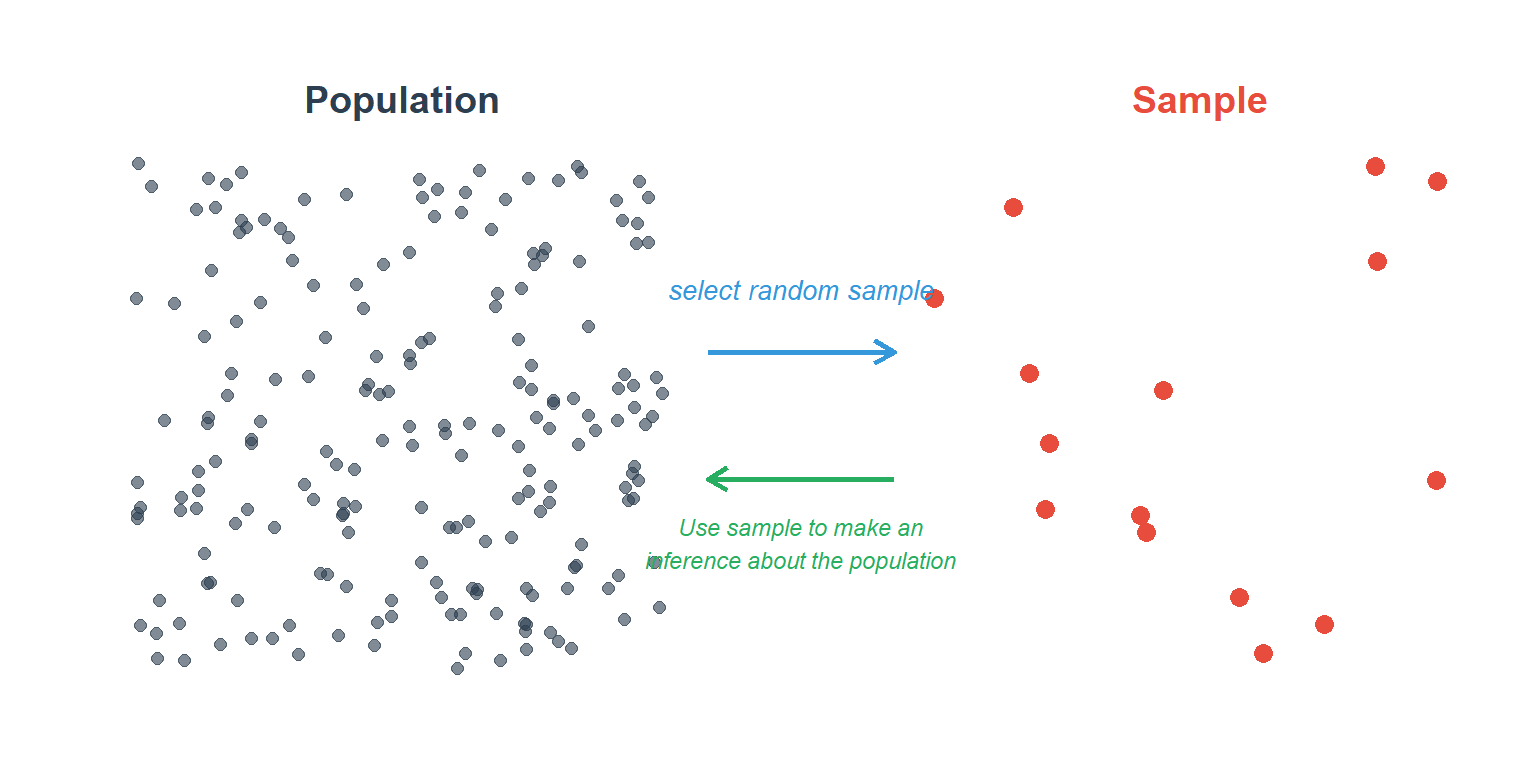
We summarise the values of the characteristic in the sample (the summary is called the sample statistic – for example ‘average’ age). We then make an inference about the corresponding summary value (called the population parameter) in the entire population.
An important assumption is that the sample is representative of the entire population. To achieve this, individuals in the sample must be selected randomly from the entire population. Random selection means that every person in the population has the same probability of being selected to the sample.
code
# Create a visual representation of the inference processset.seed(42)pop_data <-tibble(x =runif(200, 0, 4),y =runif(200, 0, 4))sample_indices <-sample(1:200, 15)sample_data <- pop_data[sample_indices, ]ggplot() +geom_point(data = pop_data, aes(x = x, y = y), colour ="#2c3e50", size =2, alpha =0.6) +geom_point(data = sample_data, aes(x = x +6, y = y), colour ="#e74c3c", size =3) +annotate("text", x =2, y =4.5, label ="Population", size =5, fontface ="bold", colour ="#2c3e50") +annotate("text", x =8, y =4.5, label ="Sample", size =5, fontface ="bold", colour ="#e74c3c") +annotate("segment", x =4.3, xend =5.7, y =2.5, yend =2.5,arrow =arrow(length =unit(0.3, "cm")), colour ="#3498db", linewidth =1) +annotate("text", x =5, y =3, label ="select random sample", size =3.5, colour ="#3498db", fontface ="italic") +annotate("segment", x =5.7, xend =4.3, y =1.5, yend =1.5,arrow =arrow(length =unit(0.3, "cm")), colour ="#27ae60", linewidth =1) +annotate("text", x =5, y =1, label ="Use sample to make an\ninference about the population", size =3, colour ="#27ae60", fontface ="italic") +theme_void() +coord_cartesian(xlim =c(-0.5, 10), ylim =c(-0.5, 5))
Figure 3.1: Using a sample to make inferences about the population
3.2 Random Sampling
The above strategy is called simple random sampling. There are other selection strategies, including stratified random sampling and cluster sampling. At their core is random selection, and the notion that we cannot predict which individual will be included in the sample.
Sampling Method
Description
Simple random sampling
Every individual has an equal chance of selection
Stratified random sampling
Population divided into subgroups, then random samples from each
Cluster sampling
Random selection of groups, then study all individuals within selected groups
3.3 Selection Bias
Bias is a type of error that systematically skews results in a certain direction. Selection bias is a common type of error. The decision about who to include in a study can throw findings into doubt.
Selection bias can occur when the researcher decides who is going to be studied. It is usually associated with research where the selection of participants isn’t random (i.e. with observational studies such as cohort, case-control and cross-sectional studies). Random selection helps reduce selection bias by ensuring each individual has an equal chance of being selected.
Even then selection bias occurs when people agree or decline to participate in a study. Those who choose to join (i.e. who self-select into the study) may share a characteristic that makes them different from non-participants.
Often, selection bias is unavoidable. That’s why it’s important for researchers to examine their study design for this type of bias and find ways to adjust for it, and to acknowledge it in their study report.
3.4 Summary
Term
Definition
Population
The entire group of individuals whose characteristics we are interested in
Sample
A subset of individuals selected from the population
Variable
A characteristic that varies from individual to individual
Sample statistic
A summary calculated from sample data (e.g. mean age)
Population parameter
The true value in the whole population (usually unknown)
Random selection
Every person has the same probability of being selected
Selection bias
Systematic error from non-representative sample selection